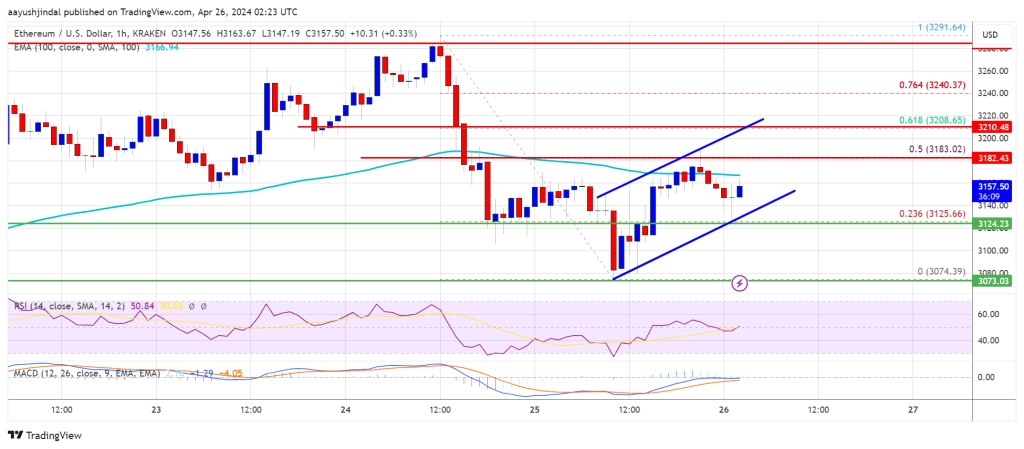
Ethereum price is attempting a recovery wave above the $3,125 zone. ETH must clear the $3,200 resistance to continue higher in the near term.
- Ethereum extended losses and tested the $3,075 support zone.
- The price is trading below $3,180 and the 100-hourly Simple Moving Average.
- There is a key rising channel forming with support at $3,140 on the hourly chart of ETH/USD (data feed via Kraken).
- The pair could continue to move down if it trades below the $3,125 support.
Ethereum Price Faces Resistance
Ethereum price struggled to recover and extended losses below the $3,100 level. ETH traded as low as $3,074 and is currently attempting another recovery wave, like Bitcoin.
There was a minor increase above the $3,125 resistance. The price climbed above the 23.6% Fib retracement level of the recent drop from the $3,292 swing high to the $3,074 low. However, the bears are active near the $3,200 resistance zone.
Ethereum is now trading below $3,180 and the 100-hourly Simple Moving Average. There is also a key rising channel forming with support at $3,140 on the hourly chart of ETH/USD. Immediate resistance is near the $3,180 level and the 100-hourly Simple Moving Average.
The first major resistance is near the $3,200 level or the 61.8% Fib retracement level of the recent drop from the $3,292 swing high to the $3,074 low.
Source: ETHUSD on TradingView.com
The next key resistance sits at $3,240, above which the price might gain traction and rise toward the $3,280 level. A close above the $3,280 resistance could send the price toward the $3,350 resistance. If there is a move above the $3,350 resistance, Ethereum could even test the $3,500 resistance. Any more gains could send Ether toward the $3,550 resistance zone.
More Downsides In ETH?
If Ethereum fails to clear the $3,180 resistance, it could continue to move down. Initial support on the downside is near the $3,125 level. The first major support is near the $3,075 zone.
The main support is near the $3,030 level. A clear move below the $3,030 support might set the pace for more losses and send the price toward $2,880. Any more losses might send the price toward the $2,750 level in the near term.
Technical Indicators
Hourly MACD – The MACD for ETH/USD is losing momentum in the bearish zone.
Hourly RSI – The RSI for ETH/USD is now below the 50 level.
Major Support Level – $3,125
Major Resistance Level – $3,200
Disclaimer: The views and opinions expressed in this blog post are solely those of the author(s) and do not necessarily reflect the official policy or position of Cointacted. Any content provided herein is for informational purposes only and should not be construed as financial, investment, legal, or other professional advice. Readers are encouraged to seek independent advice and conduct their own research before making any investment decisions


It’s fascinating to see Ethereum’s price dynamics playing out, especially with the ongoing recovery attempts. The battle around key resistance levels like $3,200 is certainly worth watching closely. The technical indicators provide some insights, but the market sentiment remains crucial. As always, it’s essential for investors to stay informed and exercise caution in these volatile times. Excited to see how Ethereum navigates these challenges ahead!