Bitcoin continues with its sluggish trend as the price remains stuck within a range-bound level. The extreme drop in volatility does flash bullish signals but the bearish knockout may not be eliminated. With the prices hovering within the range for quite a while, a strong base has been formed. This may lead to a massive bullish breakout, while pre-halving may tend to occur, which may also cease very soon.
The current trade suggests the price is either experiencing excessive pressure on either side or both the bulls and bears have become passive. Therefore, without much involvement from them, the price may have remained stuck at the same levels. Besides, more accumulation has been witnessed at these levels, as millions of addresses have accumulated millions of BTC at the current price level.
As per the data from Intotheblock, shared by an analyst, Ali, over 3 million addresses have bought nearly 1.5 million BTC between $41,800 and $43,080.
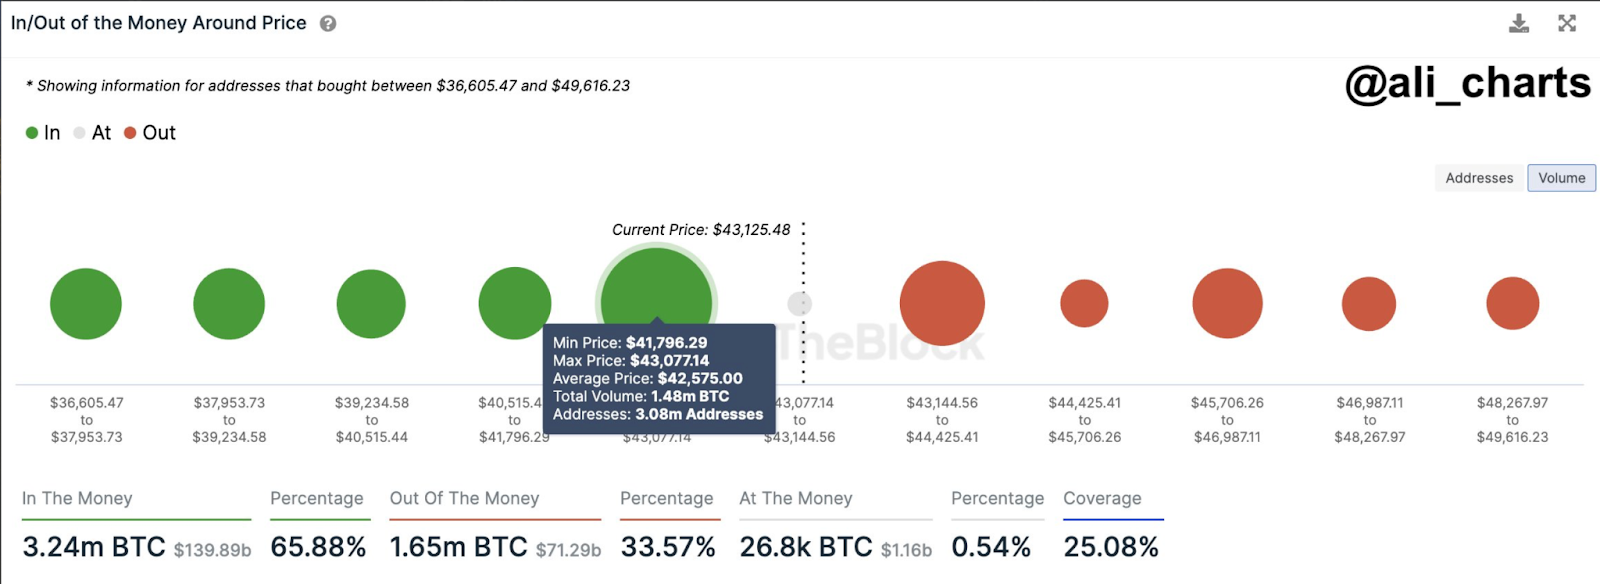
These levels have become one of the strongest support zones for the Bitcoin price as of now and this could be the reason why the BTC price triggers a healthy rebound each time it tests. On the other hand, the price has also been failing to rise above $43,800, which is the pivotal resistance that needs to be broken to initiate a fresh upswing. So will the BTC price break the resistance wall?
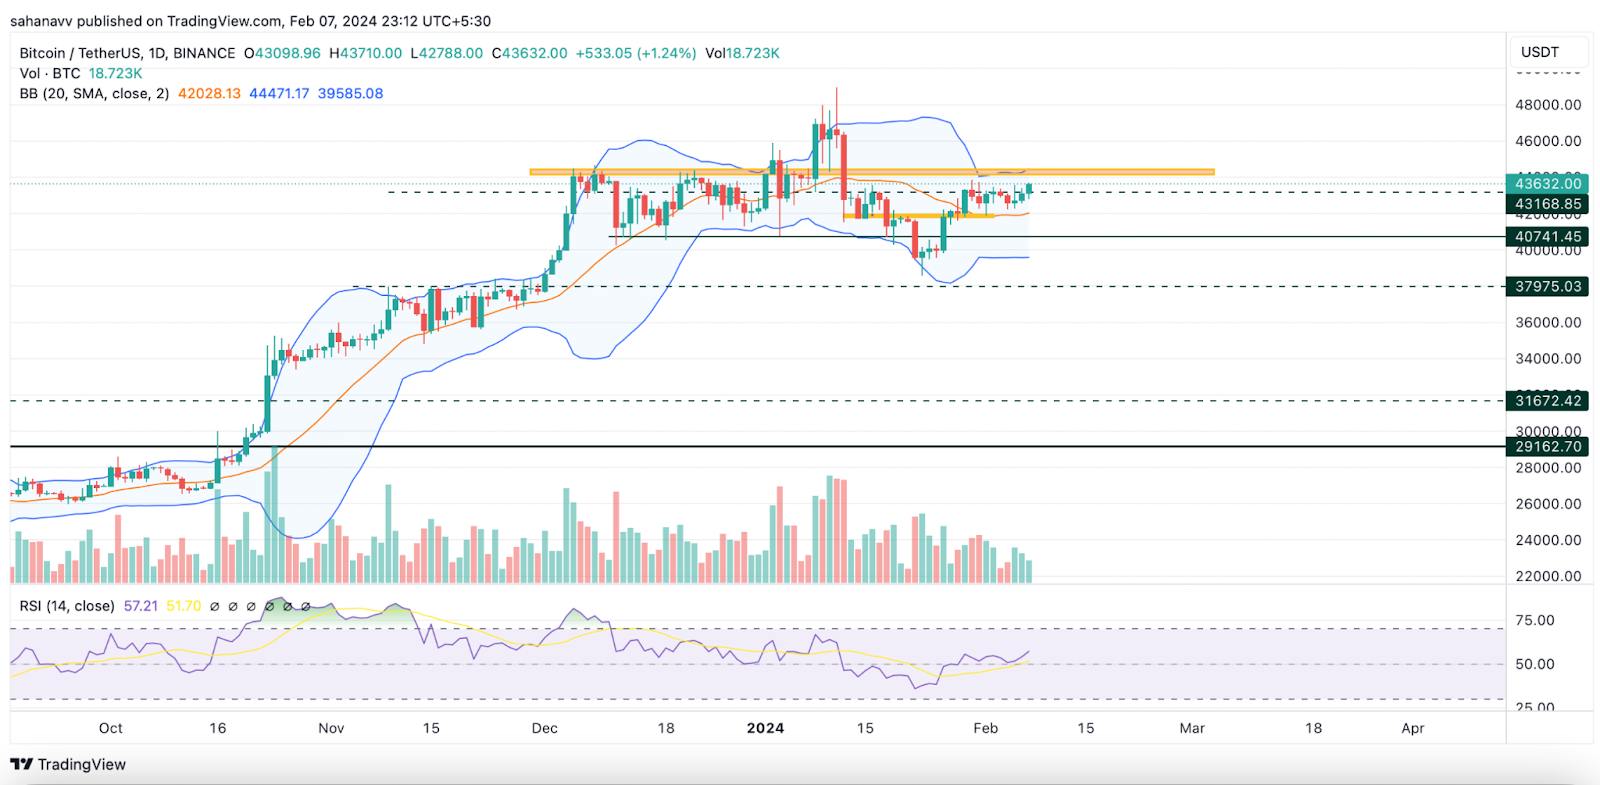
The above chart displays that the price is trading sideways, due to which the Bollinger bands are going parallel with each other. Even though the volume has dropped, the slight rise in the RSI flashes bullish hopes for the crypto. The bands are trading at the exact resistance and support levels. Hence, a breakout from either of the ranges may validate the respective price action.
The current trade setup suggests that the Bitcoin (BTC) price may reach the interim resistance and may even rise above $45,000 but it may result in a bearish pullback, back to the average levels of the band.